Reallymy
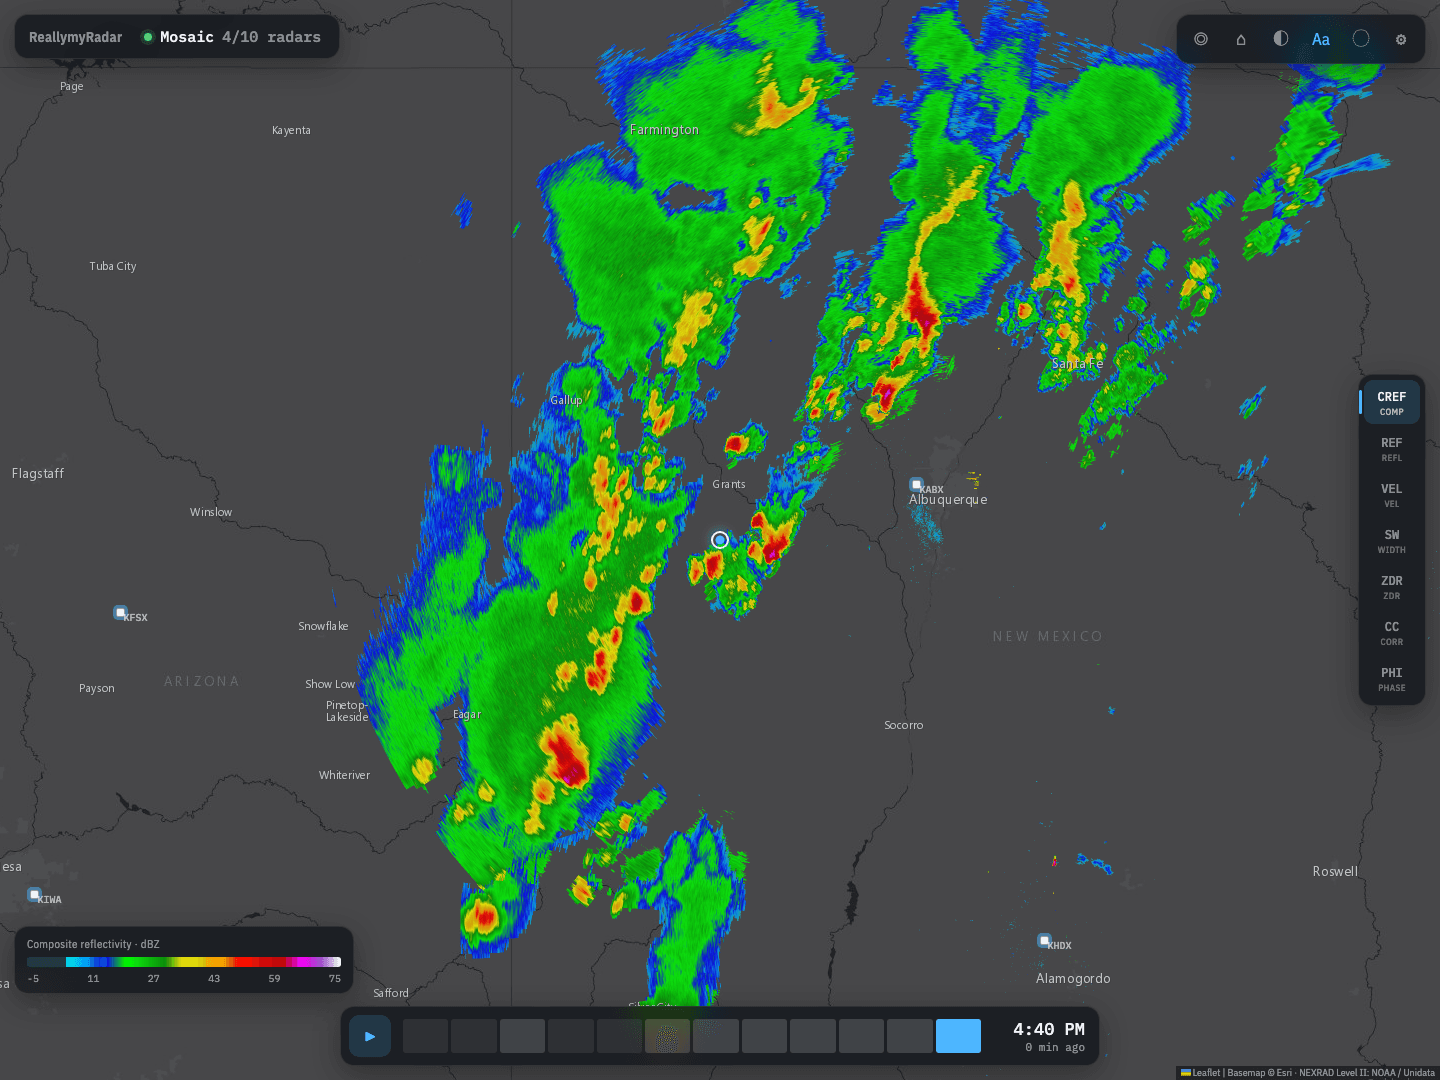
ReallymyRadar is a weather radar server that runs at home. It downloads raw NEXRAD Level II data from NOAA's public AWS buckets, decodes it at full super-resolution, blends the nearby radars into one seamless mosaic, and serves the result to every device on the network as a live viewer, map tiles, finished images and a JSON API. It runs as a tray app on macOS, Windows and Linux, or headless in Docker.
At a glance
- Type
- App
- Industry
- Weather
- Built with
- Python 3.12, FastAPI, NumPy, SciPy and Py-ART, with a Leaflet viewer
- Platforms
- macOS, Windows and Linux tray app; headless server or Docker image
- Radars
- All 162 NEXRAD WSR-88D sites, plus 45 airport TDWRs
- Codebase
- About 3,300 lines of Python and JavaScript
Raw radar data, only where it's needed
The data comes straight from NOAA's public Level II buckets on AWS. Complete volumes fill in the animation loop, and the live chunk feed is re-decoded as each tilt of the current scan finishes, so the lowest tilt is about a minute old.
Radars download only while something is looking at their area, or when they're pinned, and go idle after a set time. A viewer, a kiosk or an API call each wake just the radars they need.
A mosaic drawn from the gates
Radar beams widen with range, so every spot is drawn from the closest radar that covers it, with neighbors blended over a 20 km seam. A farther radar can fill a spot the closest one can't see, such as behind terrain, when it sees at least 20 dBZ.
Rendering never goes through an intermediate grid. Every output pixel is projected back to each radar, using a WGS84 azimuthal-equidistant projection and a 4/3-earth beam model, and sampled from the native 0.5 degree by 250 m gates with bilinear blending. Zooming in keeps getting sharper.
Cleaner radar
Bugs, birds and ground clutter are removed using the dual-polarization correlation coefficient, but only when the echo is also weak, so strong low-correlation signatures like tornado debris stay on the map. Isolated specks are removed and velocity is dealiased.
Seven products are available: composite and base reflectivity, velocity, spectrum width, differential reflectivity, correlation coefficient and differential phase.
One server, many screens
The same server feeds a browser viewer with live tuning, XYZ map tiles for Leaflet, MapLibre or Home Assistant, finished PNG, JPEG and WebP pictures with a basemap, labels and legend, animated loops, and a full-screen kiosk page for a Raspberry Pi that only has to flip images.
A JSON API answers point questions, like whether it's raining at a spot and how hard, with values from every product, the source radar and the scan time. CORS is open for GET, and interactive API docs ship with every install. Settings live in one JSON file that the viewer, the API and a text editor can all change live.
Packaged for every desktop
The tray icon doubles as a status light: green when data is flowing, amber while radars download and red on errors. The app can start at login and keeps the computer from idle-sleeping while it runs, so kiosks never lose the picture.
GitHub Actions builds the app for macOS, Windows and Linux with PyInstaller on every push and smoke-tests each build headless before it's kept. A Docker image with a health check covers servers, NAS boxes and the Raspberry Pi.
Highlights
- Full-resolution NEXRAD Level II decoding, about a minute behind the radar.
- A seamless multi-radar mosaic rendered pixel by pixel from the native gates, with no intermediate grid.
- Dual-polarization clutter filtering that keeps tornado debris.
- Viewer, map tiles, finished images, a kiosk page and a JSON API from one server.
- Tray apps for macOS, Windows and Linux built and smoke-tested in CI, plus a Docker image.
Let's talk.
Tell me what you're building. I read every message myself and usually reply within one business day.